The Necessity of Focused Presentations
 The development of modern technologies created a great possibility of gathering a large amount of data on different process-production, manufacturing, exploration, logistics and supply chain as well as other, providing the basics for scientific management.
This data, providing the benefits for a scientific decision making, also creates a clouds of data which can hide or make difficult to reach the proper decision.
While conducting different Lean and Six Sigma projects, many researchers and consultants, have identified a fact that the decision makers usually do not have time to read through the reports, and are mostly focused on one to two pages which they consider important for making a decision.
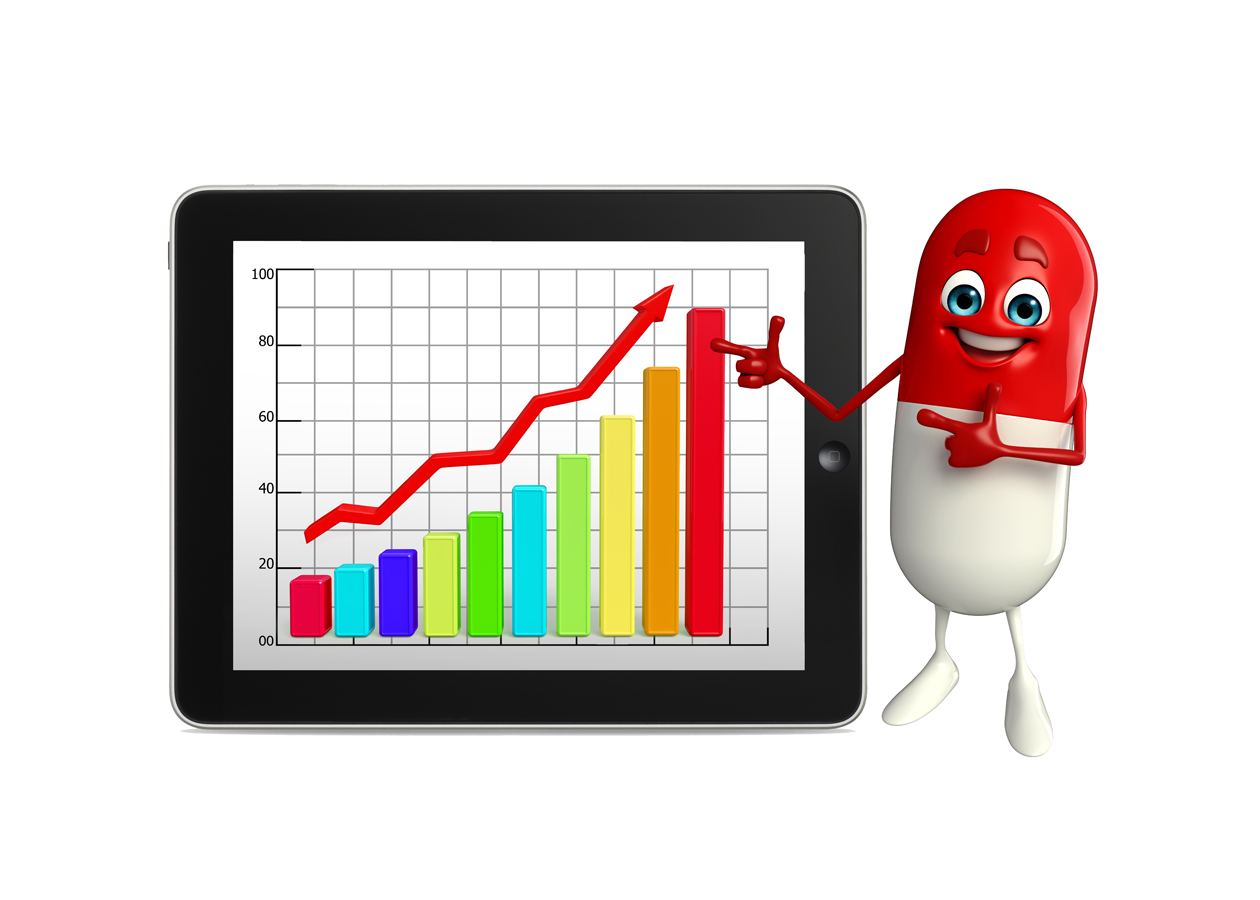
This creates a necessity for focused presentations, with a possibility to present a story on a single slide.
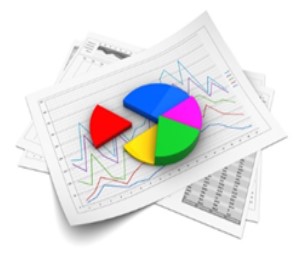
And thus come Infographics. Infographics are defined as:
Infographics (a clipped compound of “information” and “graphics”) are graphic visual representations of information, data or knowledge intended to present information quickly and clearly. They can improve cognition by utilizing graphics to enhance the human visual system’s ability to see patterns and trends.
By this definition, the analysts, engineers and other people who need to present findings of their analysis to the decision 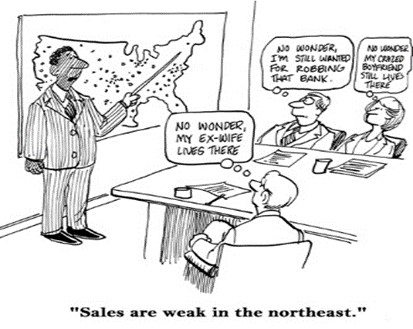 makes are bound by the need to present these findings in an effective, quick and clear manner.
Therefore, executive summaries will be more and more replaced by the Infographics, where the main message will be presented on a single slide or page and without the need to read through the paragraphs while trying to extract the main finding from the many listed findings and recommendations from the listed ones.
This in effect creates a need for the people preparing reports to focus on effective creation of Infographics, where the main message (finding, recommendation, result, etc.) will be presented clearly and all the data used is presented and arranged to create a support and emphasis of the main message that the report creator (creators) want to present.
Also, from the personal experience of the author, while creating Infographic, and trying to arrange the data, the pattern related to the iceberg theory became quite obvious.
After the domino theory most prominent theory was Iceberg Theory, (also known as the “theory of omission”) which was basically the writing style of American 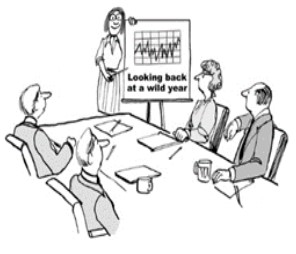 writer Ernest Hemingway. The theory basically states that there is much more below the surface than it is clearly visible on the surface (like the iceberg, where 90% of the mass is actually bellow the water surface).
While creating an iceberg related to the average incident cost, where the insured costs were the part of the iceberg that was above the water (Insured costs: Covering injury, ill health, damage), presenting the incident cost that we can see, while the uninsured cost was below the water surface (Penalties, Employee Morale, Investigation Cost, Recovery Cost, Lost Work Time, Business Reputation and other) presenting almost 11 times higher cost, which was hidden, and not so obvious, the Infographic created had all the elements present which were there in nature. Namely: water, ice, clouds and sun.
This pattern now presented the obvious solution to the problem-reducing the incidents in a way the nature reduces and eliminates icebergs.
This way, it is shortly described in the following: the sun warms the surface of the iceberg, thus melting the ice, while at the same time warming the water in which the iceberg floats, therefore melting the iceberg lower part.
By following this pattern, where the sun actually much faster melts the iceberg trough the warmth of the water than through the direct warming of the iceberg part which is above the water, the solution to most of the root cause problems (which is both fast and more effective) is not a direct influence on the iceberg-the incident or the problem, but actually influence on the environment in which the iceberg appears.
The warmer the water, the iceberg will melt away faster.
Basically, by creating the environment which can absorb and remove mistakes (which are unfortunately inevitable) the solution to the company’s problems are more effective and longer lasting.
Creating Infographics helps you as the person who did a lot of work and analyzed the data in determining the patterns and trends, as well as re-examining your evidences that support the result or recommendation you came up to.
 This is a valuable tool that can be used as a final checkup of your report, where by creating your Infographic, you can see is the conclusion emphasized enough, and also is it well supported by the results of the analysis.
Making yourself effective in creating Infographics, can actually make you quite effective in analysis of the data as well as identifying patterns and trends.
In today’s world where the scientific management and speed in the decision making is the cutting edge of competiveness, effective Infographics are a valuable tool in reaching appropriate and effective decisions, while at the same time avoiding lengthy process of decision making based on painstaking meetings where you have to go through each and every page of the report, especially when most of the people actually did no read the whole report, but just bits and pieces.
Effective Infographics are a great tool, use them wisely, and for the benefit of all.
GLOMACS have the process, expertise and training to equip you with necessary skills to analyse numerical data, report and use graphics to present the data.
Infographics & Data Analytics for Oil & Gas Reporting
Info-Graphics: Data Analysis and Reporting Techniques
Advanced Data Analysis Techniques
If you wish to find out more or would like to attend the next session of this course, please do not hesitate in contacting a member of the GLOMACS team.
The 04-08 February session of the training on Infographics & Data Analytics for Oil & Gas Reporting will be done by a GLOMACS Senior Consultant, specializing in Project Management in Oil and Gas industry, Risk Management, Root Cause Analysis, Incident Investigation, Civil Engineering and Optimization in Logistics and Supply Chain.
Dubai - UAE
P. O. Box
74653
Tel: +971 (04) 425 0700
Fax: +971 (04) 425 0701
Tax Registration Number: 100270246000003