Exploiting Big Data for the Automated Abnormality Detection of Complex Manufacturing Plant
 Recent years have seen a huge growth in the complexity of manufacturing plant, and of the measurement and control systems that it uses. These developments have been spurred‐on by worldwide common goals to increase plant reliability, to improve health, safety and environmental performance, and to maximise process efficiency which in turn will reduce manufacturing costs. Modern manufacturing plant typically has one or more layered control systems, an on‐line condition monitoring function, and an extensive array of process and performance measurement systems. These may to greater or lesser degrees share one or more digital automation networks like industrial Ethernet or a field bus.
Hundreds and hundreds of process control, condition‐indicating, performance‐measuring, and quality control parameters are routinely measured on a typical piece of modern manufacturing plant. And yet the purposes to which all of this data is put are only two‐fold:
1. Keeping the plant operating within a control regime, and
2. Assessing the condition, performance and efficiency of the operating plant and hence of the process.
Control engineers use closed loop feedback systems to address the first of the above two purposes, but condition based maintenance, reliability and performance / efficiency assessment functions cannot be fulfilled in a closed loop manner. The key to this latter grouping of assessments is, as has always been the case, answering the question “has anything changed?” This question could be asked in the context of ‘change since the last measurement was taken’, or ‘change from a predetermined baseline’, but in either case it is still an assessment of change. In essence it is a question of “is this machine (or process) behaving normally?”.
 Engineers have spent enormous amounts of time and effort developing diagnostic, fault location, prognostic and many other information extraction routines which are very capable in interpreting abnormal behaviour and identifying the necessary actions that need to be taken to correct faults, rectify errors and re-tune sub optimal characteristics.
Although, when invoked, these information extraction routines are often highly effective in their intended functions of identifying appropriate corrective action, they are simply not suitable for routine application to all monitored data because of their interactive expert user‐input needs and the computational overhead aspects that typically accompany them.
Such routines are designed to be used, and are only suitable to be invoked, when something abnormal has been observed, and herein lies the problem: from numerous parallel channels of disparate data, derived from condition monitoring, process performance and quality control systems, all measured on a complex piece of multi‐tasking manufacturing equipment, how is it possible to obtain an automated, reliable and robust assessment of the normality (or otherwise) of the ‘observed’ plant behaviour.
For simple machines, running at constant speed, with non‐varying loads, and with only one product type and function, the assessment of normality can often be reliably and accurately made using fixed thresholds (sometimes called symptom limits in maintenance) which are applied to individual monitored data channels.
Such thresholds can be determined from experience, or by trial and error, but modern approaches generally use statistical methods which set thresholds based upon confidence intervals expressed as numbers of standard deviations away from the mean of the data. Indeed this is the statistical definition of data normality. This approach lies at the heart of the Six Sigma approach to statistical process and quality control.
Time‐invariant (ie fixed or static) thresholds, obtained using Six Sigma‐style statistical approaches, are, however, only able to provide sensitive and reliable automated assessment of the normality of a data trend if the trend has a stationary mean value (i.e the data is time invariant). And sadly, the vast majority of data monitored on a modern manufacturing system is very much not time invariant. An example of the inappropriateness of a statistically‐derived time‐invariant approach to thresholding of data is shown below (data is an error feedback signal for the speed control governor on a large diesel engine).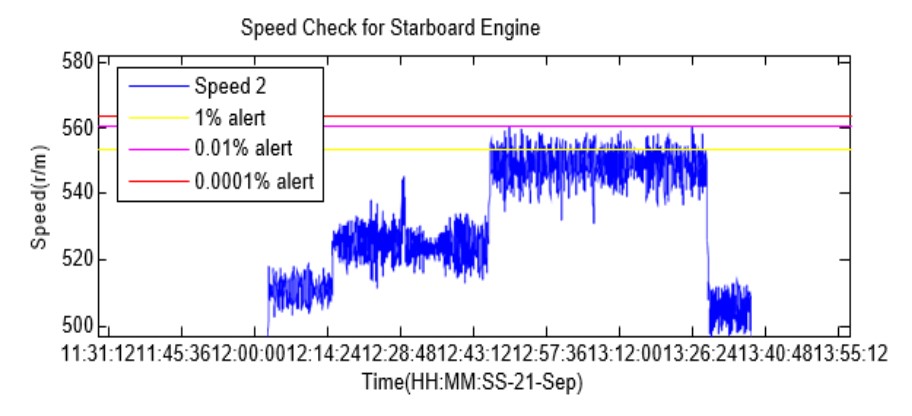 State of the art manufacturing machines generally operate within some complex envelope of variable speed, variable load, variable product and variable manufacturing function circumstances.These factors mean that conventional statistical approaches to automated abnormality detection cannot be used, and this in turn leaves engineers with no straightforward and automated means of assessing whether or not their plant is deteriorating, drifting in terms of efficiency / performance, or operating in a sub optimal manner. Many manuals on Six Sigma (and related approaches to statistical process and quality control) make the point that the best source of experience when assessing whether or not a process or system is exhibiting normal behaviour is the previously observed behaviour of the process or system itself. This is the fundamental tenet of these statistical approaches.
Previously unrelated to conventional statistical approaches to abnormality assesment, is the concept of information overlap, occasionally referred by engineers and computational scientist: the idea that if you simultaneously measure multiple parameters on a machine or process, the information contained within them will be inherently interrelated becuse all of the data channels were measured on the same machine, whilst it was doing the same thing.
Sometimes the inherent interrelationships are predictable, based on engineering or process principles, for example the load on an engine is likely to be closely and linearly related to the flow rate of fuel that the engine is consuming. In the majority of cases, however, the interrelationships between different data channels in a complex system are neither so predictable as in the engine example, nor so linear. Yet numerous studies show that these interrelationships will still exist: perhaps more subtle, likely more nonlinear, often more surprising (and hence potentially enlightening) and almost always more extensive in terms of the number of data channels exhibiting underlying correlations with any other channel.
The enlightening issue becomes particularly interesting and potentially very powerful as data sources become more diverse – for example the overlapping of information between data channels monitored for (say) plant control purposes, with data channels monitored (say) for condition based maintenance, or efficiency measurement purposes.
Data mining approaches now make it feasible to develop automated algorithmic approaches to extracting the underlying multivariate nonlinear correlations contained within large multichannel data sets from manufacturing systems, and then to use these as a basis of a multi‐dimensional statistical process / quality control approach for assessing the normality of observed behaviour.
In non‐mathematical terms, the concept hinges around the extent to which the notion of experience can be extended from the presently‐used (e.g. Six Sigma) single data channel approach (whereby only the previous data observations from any particular data channel are used to assess the future normality of that data channel) to an automated multi‐channel approach, whereby the previously observed behaviour of all relevant other data channels can be combined and hence used to assess the normality of any particular data channel.
Multichannel signal processing of disparate asynchronous data from complex plant and systems, has already been pioneered, with very successful results, from applications as diverse as:
1. The condition monitoring of propulsion and steering systems on modern diesel and diesel electric ships,
2. The Performance and efficiency assessment of large gas‐fired steam turbine‐driven power generating plant,
3. And the identification of animal health anomalies within the multichannel electrocardiograph, hemodynamic, and respiratory (pulse oximetric and capnographic) data of cattle
The potential offered by the approach to the automated monitoring of manufacturing plant is perhaps best demonstrated by example, using data from the first of the three non‐manufacturing applications listed above.
On behalf of one of the world’s largest designers and builders of ships the approach has been applied to propulsion systems, generator systems, thrusters, steering gear and deck equipment (winches, cranes, etc). The ship in question involves around 3000 separate channels of data, monitored at 1‐second intervals; propulsion is via two V12 diesel engines (port and starboard) driving directly coupled variable pitch contra‐rotating propellers. Being V‐configuration engines of this size, each of the two banks of cylinders (A and B) on each engine has its own turbocharger.
The trend graph results below show the automatically calculated red (alarm) and amber (warning) confidence limits for the normality of the speed data of the turbocharger on one bank of one engine, and over a 24 hour period of operation.
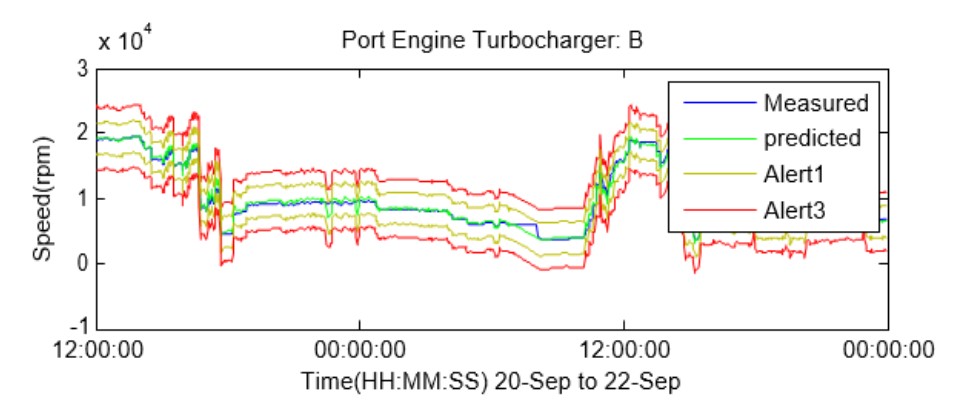
The first thing to observe from the example capability is that, over the 24 hour period, the measured speed of the turbocharger (blue line) varies widely, from around 4000 to around 19000 rpm. It is clearly very much non‐stationary data. This is understandable because the ship will have been undertaking different duties, encountering different sea states, and possibly undergoing changes in on‐board load.
The second observation is that the blue line of measured data is closely mimicked by a green line of ‘predicted data’. This is an automatically created empirically‐based (i.e data driven) prediction of the turbocharger speed, based upon the overlap of information that was automatically detected and extracted from previous values for this particular channel of turbocharger speed data and previous values of all of the other monitored parameters on the ship.
The predicted‐value trend permits confidence intervals to be applied to it, using conventional Six Sigma approaches, and these then form both upwards‐ and downwards‐going thresholds of normality for the real data, irrespective of the operating and environmental conditions being experienced by the vessel. In the graph above, the amber lines paralleling the model‐predicted data show the bounds of a statistical definition of normal behaviour, and the red lines the bounds of a corresponding definition of acceptable but abnormal behaviour.
The power of the approach is best summarised by imagining the answer that you would get if you asked an experienced marine engineer if he / she would be able to predict, to a high degree of accuracy, the instantaneous speed of a turbocharger, on one bank of cylinders, on one of two 12MW diesel engines, on a ship undergoing varied duties, in varied sea states, with varied loads, with different people at the helm, with different environmental conditions, and for all of a 24 hour period with a time resolution of 1 second… The answer would likely not be polite!
And yet this is effectively what the engineer is being asked to do, not just for channel number ‘123’ of the circa 3000 channels of data on the ship, but for each and every channel, at every instance in time, and just to be sure that everything is normal.
The potential insight offered by big data approaches to the automated assessment of the condition and performance of a modern manufacturing system is evidently huge.
Dubai - UAE
P. O. Box
74653
Tel: +971 (04) 425 0700
Fax: +971 (04) 425 0701
Tax Registration Number: 100270246000003